
Different ways to present your Social Impact Report or data
One of the things I’m super passionate about is that we share information in a way that is relatable and understood by our audiences. When it comes to impact data and your social impact report I feel quite strongly about the fact it doesn’t have to be in a traditional “report” format e.g. A4 word document, pdf or printed brochure.
So I thought I’d share some other ways you can present and display your Social Impact Report and data that maybe you haven’t thought about before, as well as share some examples of how other Social Enterprises do this too.
I’d also like to invite you to share your own Impact Reports & Data, in whatever format they come in, below in the comments because many of my clients come to me asking for examples of other people’s reports and it’s not always easy to find (which is a discussion for a whole other blog post).
Different ways to present your Social Impact
Social Impact Reports
We’ll start with what we know. The classic report format that is usually the go to way Social Enterprises look to present their data. Personally I think reports have advantages and disadvantages.
The advantages being they’re a recognised format, it’s often what funders or investors are looking for and if you have it printed it’s a nice thing to have or giveaway on a stall, or when you deliver a pitch - as a piece of marketing material.
The disadvantages are the very idea of having to write a “report” appears to put most social entrepreneurs off from ever getting started. What do you include in a social impact report? What order should I put things in? How long does it need to be? Are all questions my clients ask when we’re talking about writing their first impact report.
And writing a report can be time consuming but it can also be a very comprehensive way to include your whole impact journey with stakeholders in a format that’s familiar.
At the World Social Enterprise Forum last year (2018) in Edinburgh I went to a workshop on social impact reporting and discovered two great Impact Reports from WildHearts and BeluWater.
Wildhearts have a very corporate style because of their clients but they use a lot of photographs to bring their impact story to life, meaning it’s actually not very text heavy.
Belu Water have dedicated section on their website presenting their report in webpages (but they also have this as a printed document). I particularly like the simplicity of their report all in blue and white (their brand colours) and rather than pictures they use text, numbers and a few simple infographics to communicate their impact data.
Solutions for the Planet’s impact reports (scroll to the bottom of the page) are one’s I’ve produced and provide another example of how you can present your impact combining narrative with photo’s and infographics.
2. Sharing impact as infographics on social media
A client of mine recently shared Birdsong’s impact report which they had shared as infographics on Instagram. I love this approach of both having a very visual report but then using these visuals to share via social media.

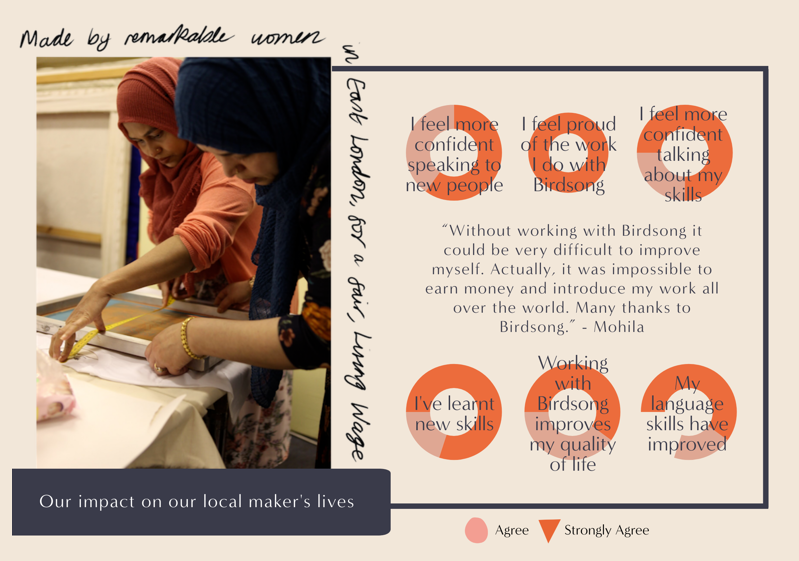
Birdsong design original wardrobe staples that are ethical, sustainable and made by talented women paid a fair wage. Their business is on Instagram and they have over 20k followers so creating a report that aligns to their strong visual brand and report pages that can be easily posted to Instagram is a very clever way of ‘killing two birds with one stone’ (sorry awful pun!)
in just 8 pages/images/infographics Birdsong have captured all the key elements of their impact story for their audience.
3. Create a presentation for your social impact data
Another very visual way to present your data is to use PowerPoint to create a few slides you can then convert this in to a PDF and share as a document or use it as a presentation in pitches, at speaking events or on your website.
Using PowerPoint I think helps with brevity, keeping it short and to the point as well as encourages you to think about images that communicate your message rather than words.
My bets friend and colleague Jen (at Solutions for the Planet) was once challenged to do a “20 in 20 presentation” - twenty slides which only had photographs/images on them delivered in twenty minutes. This is really what I believe presentations should be visual prompts for what the speaker is saying.
If you’re not going to use the powerpoint as a presentation but rather a pdf document you share via email or similar, then be selective with your wording and simply add it over an image to communicate your key message.
4. Share your Impact Story via video
All social media platforms are prioritising video these days because that’s what people want to consume. Probably because its the easiest and quickest way to consume content on the go (with wifi and headphones).
So I started looking for who shares their Social Impact Report as a video on YouTube, I surprised to only find a few. However the ones I found were fantastic. I’m sure there are more they’re probably just not fully optimised for the search “Social Enterprise Impact Report” that I searched for.
I created a playlist on YouTube of those I could find, if you have one do send me the link so I can it to this playlist.
Liberty & Justice share their Impact Story with the Founder speaking to camera and shots taken of their initiative in action.
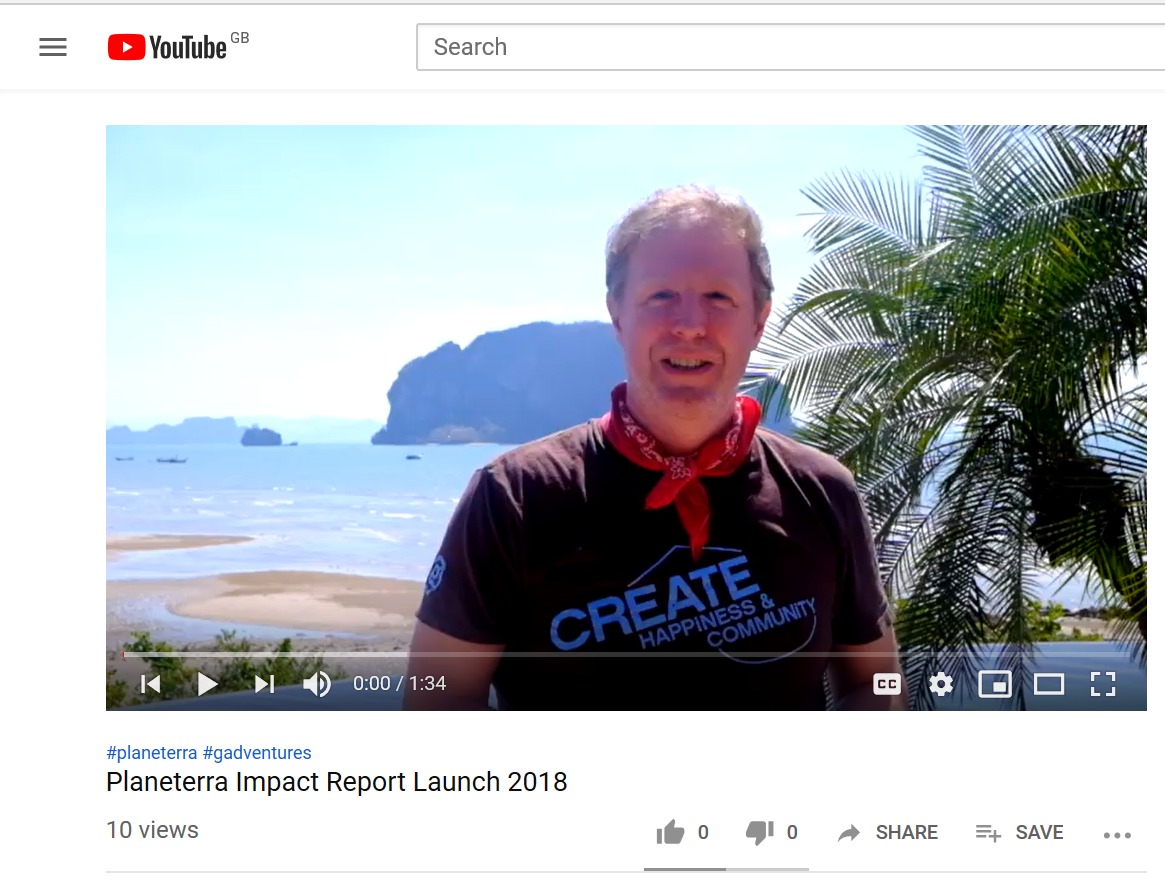
I love the informality of Planeterra’s Impact Report (because so many people say “oh we don’t have the budget to create a snazzy video”….you have a smartphone though right?). They simply asked their team, clients and partners (I think) to record themselves sharing their impact data. Yes it might have been scripted and then cut and pasted but it works! And it shows a really simple cost effective way you can do this too. No excuses!
Or if you have the budget to outsource your video creation then you could get something like Street UK did combing animation, photo’s and video.
5. Simply go LIVE on Facebook or InstaTV to share your impact story!
The easiest, quickest and therefore cheapest way to share your Social Impact is by going live on FB or Instagram. And if you don’t have that many followers yet live video is one of the best ways to engage with your existing audience and attract new followers (because both platforms give priority to this kind of content).
6. Create an impact page on your website
It always surprises me how so few social enterprises communicate anything about their social or environmental impact on their website. This is essential and can be easily achieved with an “impact page” on your website.
Remember having a page on your website isn’t enough though you also need to share it from time to time or talk about your social impact on social media and link back to the page.
Sian Conway, of Ethical Hour, shares a really useful blog on How to write an impact page for your ethical business website here and includes lots of different examples of social enterprises doing this .
This is Sian’s incredible Impact Page on her own website:

I’ve also recently added an Impact Page to my own website:

So there’s six different ways you could present and share your social impact data. I’m not suggesting you do all of these I’m just giving you different ways to think about your impact reporting and how you communicate it. If you’re stuck on which one to choose, ask yourself who’s the audience you’re trying to connect with most, what approach are they most likely to prefer or engage with best? Or what suits your time, capabilities and budget?
If you found this blog post useful, you might also be interested to read:
If you’re looking for help planning out and reporting your social impact measurement I offer 90 minute Impact Intensives, to support you with exactly that. Read more here.